
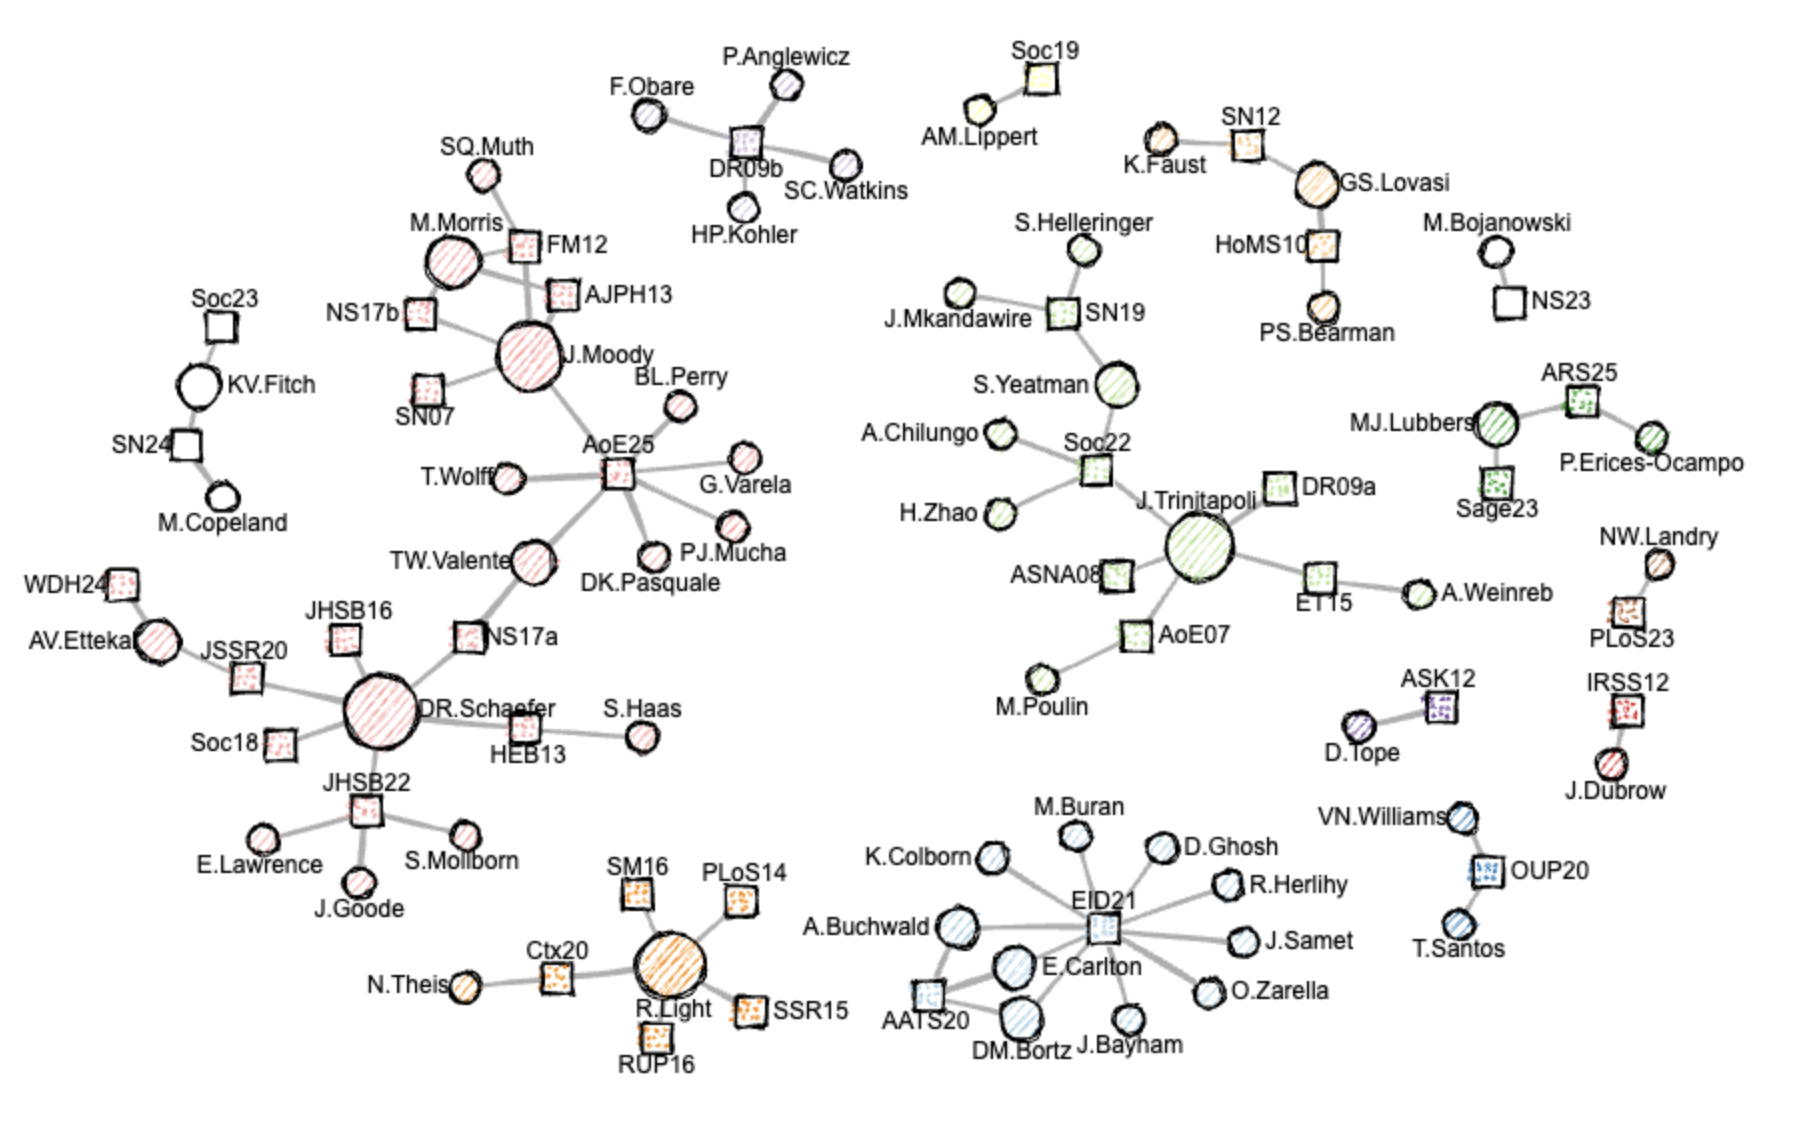
Here's my co-authorship network. Circles are people (size proportional to # of collaborations), squares are papers. Color corresponds with component; layout of components is essentially random. I created this plot with the igraph and roughnet packages in R.
There are lots of other connections that I could add here, but for now I'll just mention a few key affiliations outside of my home department.
I'm presently on the editorial boards of these journals: